001 / PYSIDE6 DESKTOP APP · V2.0.0
Hallowed CSV Logger
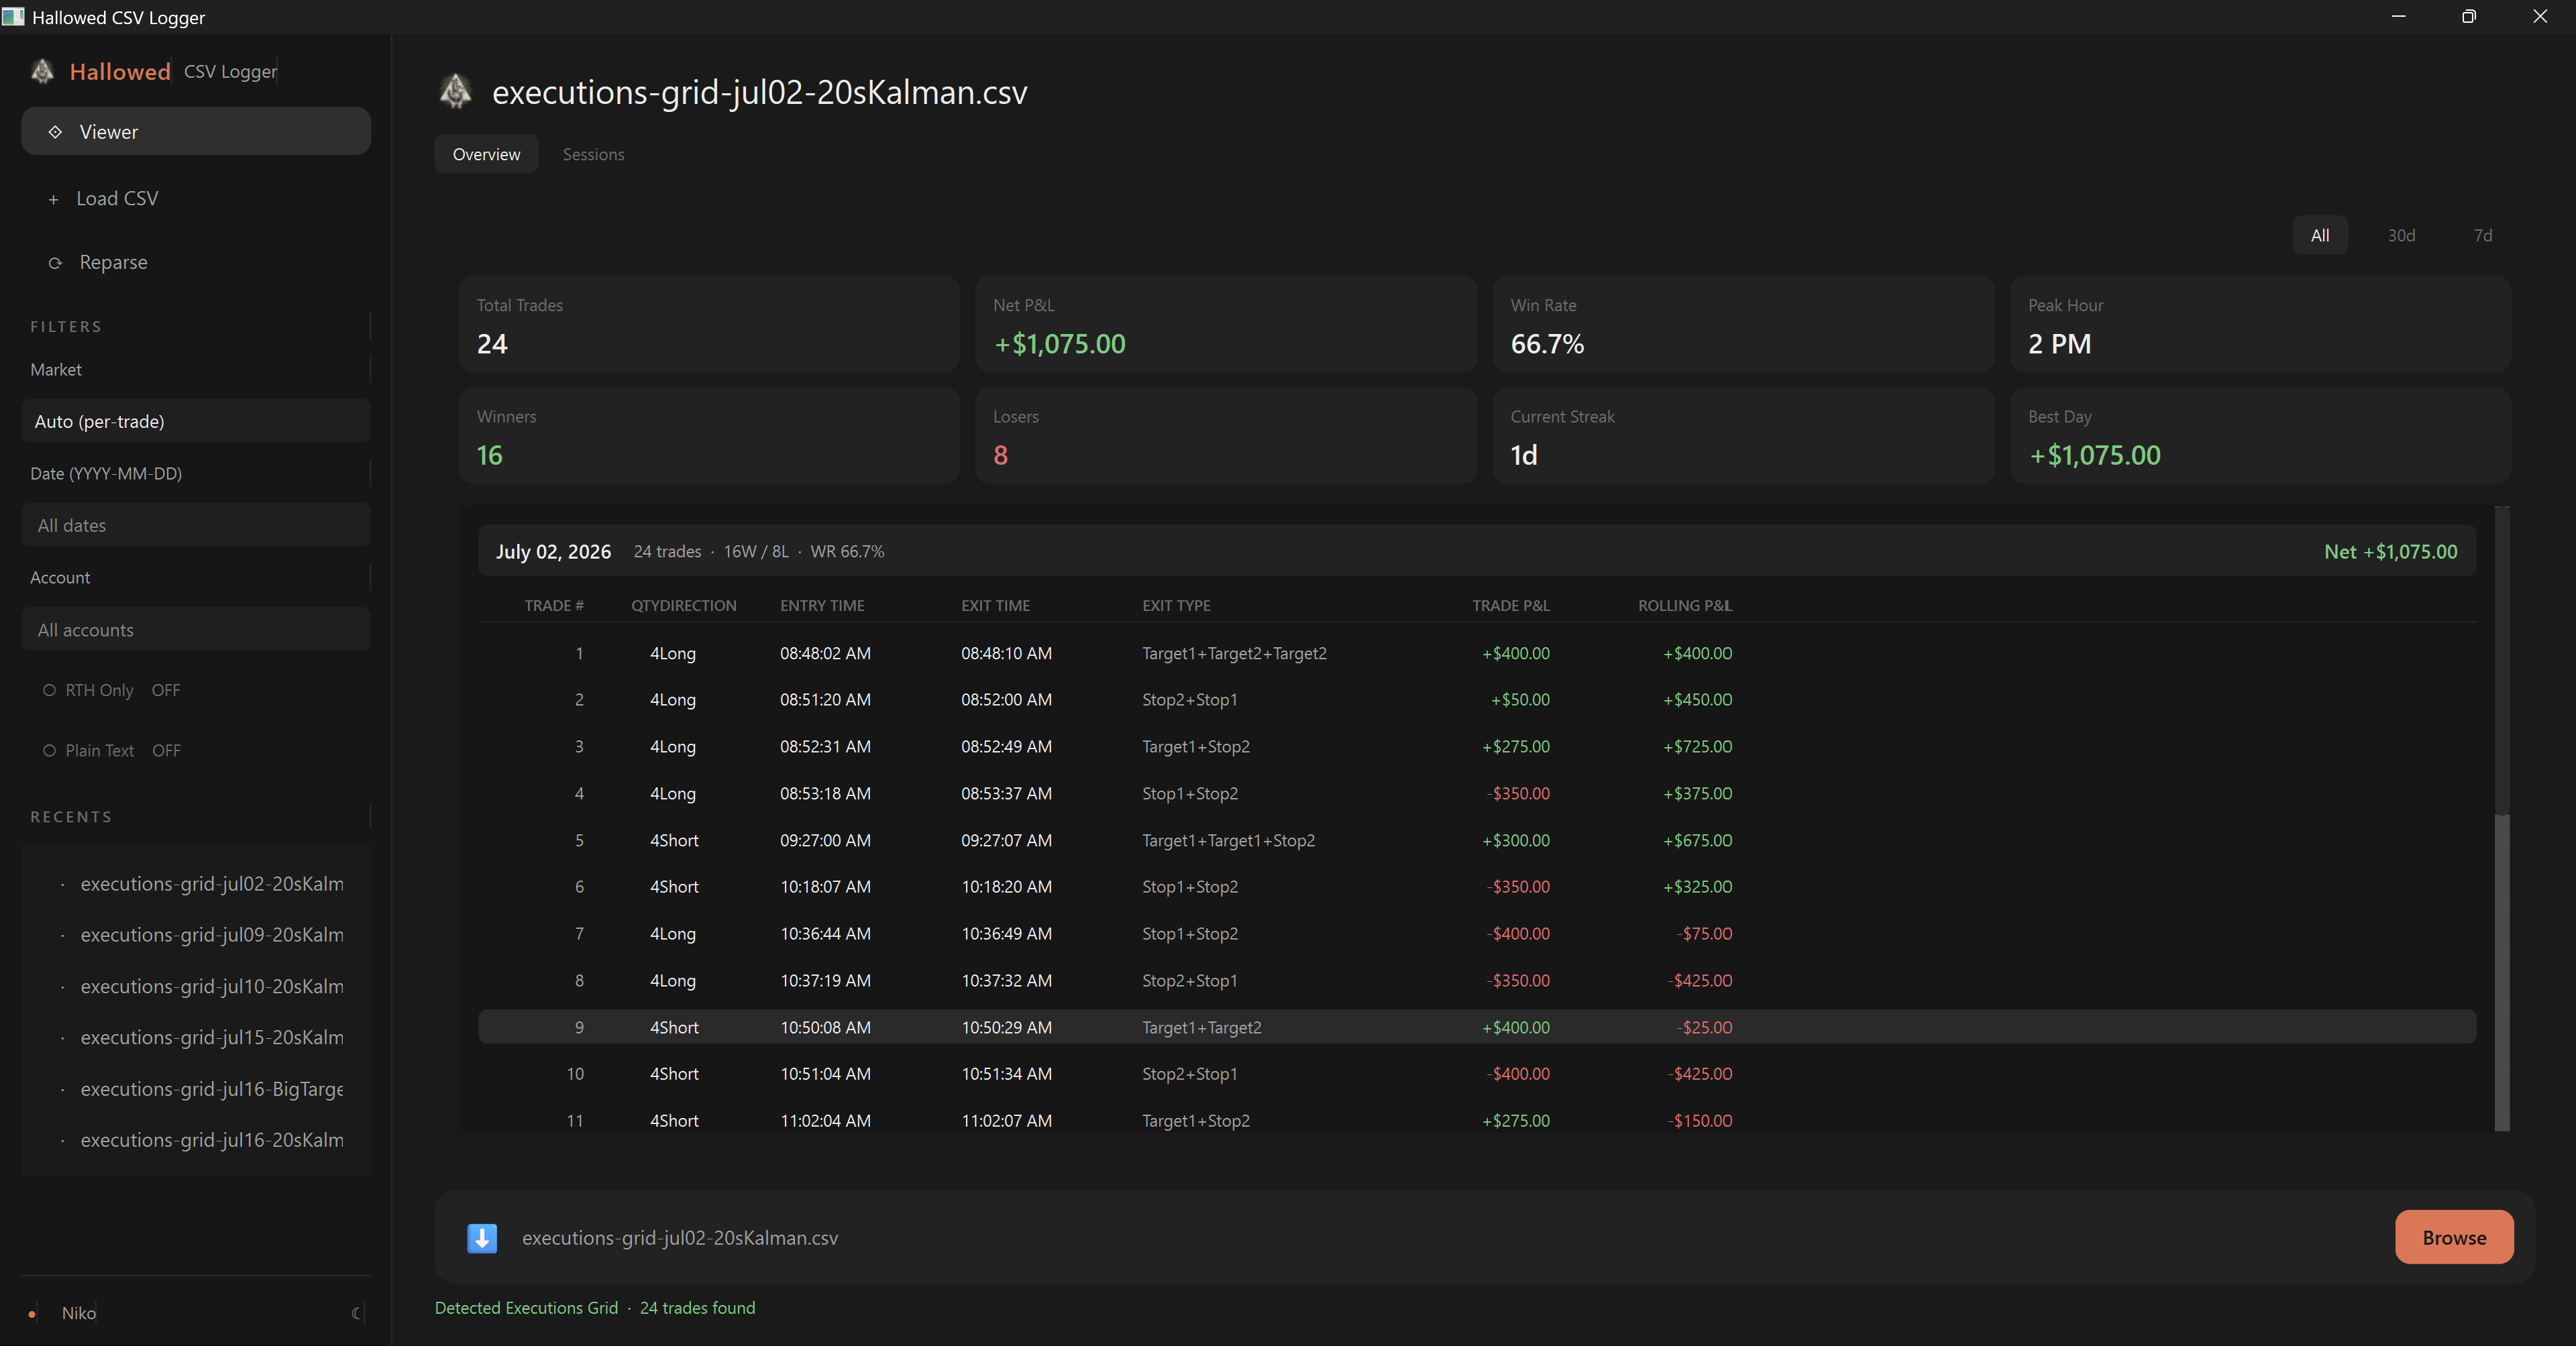
A drag-and-drop desktop app for turning NinjaTrader 8 Orders and Executions CSVs into a readable trading dashboard. It calculates net P&L, win rate, peak hour, streaks, and rolling session results. Position accounting keeps partial fills, brackets, and OCO ordering paired correctly.
- Drag-and-drop CSV parsing, Orders + Executions auto-detected
- Position-accounting trade reconstruction (partial fills, stop-and-reverse)
- Headline stats: net P&L, win rate, avg trade, peak hour
- Streak, best-day, and active-day tracking
- Session-grouped trade log with rolling P&L
- Single- & multi-leg ATM (Target/Stop 1–3, 55-Break runner)
- 40+ futures point-value registry (equity, rates, energy, metals, ags, FX, crypto)
- Filters: date, account, RTH-only, plain-text mode
- Persistent settings + standalone Windows EXE (PyInstaller)
- Plain-text & ANSI-color report export; pytest coverage